Exploring the Temporal Correlation Between Bitcoin Prices and Global M2 Money Supply: An Analysis of 45-, 75-, and 105-Day Offsets

This study examines the reported correlation between Bitcoin (BTC) prices and the global money supply (M2), as developed by Marny Marek and presented in a social media post by Colin Talks Crypto on March 11, 2025, via the platform X. The post highlights a comparative analysis of BTC price movements against global M2 data, shifted by 45, 75, and 105 days, asserting that the 105-day offset exhibits the strongest correlation. Utilizing the visual data provided in the tweet, this paper evaluates the methodological implications, statistical validity, and potential economic significance of these findings, incorporating updated correlation coefficients: -42% to 81% for the 45-day offset, 36% to 87% for the 75-day offset, and 64% to 91% for the 105-day offset. The analysis reveals the complexity of establishing causality in cryptocurrency price dynamics and emphasizes the need for robust statistical methods to validate such correlations in future research.
1. Introduction
Since its inception in 2009, Bitcoin has emerged as a decentralized digital asset with volatile price movements influenced by a myriad of factors, including investor sentiment, technological developments, regulatory actions, and macroeconomic conditions. One hypothesis gaining traction in financial discourse is the potential linkage between Bitcoin prices and global liquidity, as proxied by the M2 money supply—a broad measure of money in circulation, including cash, checking deposits, and other liquid assets. M2 is influenced by central bank policies and is often cited as an indicator of economic activity and inflation expectations.
The tweet by Colin Talks Crypto, dated March 13, 2025, presents an analysis comparing Bitcoin prices with global M2 data, offset by 45, 75, and 105 days. The post asserts that the 105-day offset demonstrates the highest correlation, suggesting a predictive relationship between global liquidity changes and Bitcoin price movements approximately three and a half months later. This study critically assesses the validity, implications, and limitations of this claim, drawing on the visual data provided in the tweet and broader economic theory, while acknowledging the foundational work of @MarnyMarek, whose original analysis inspired this exploration.
2. Methodology
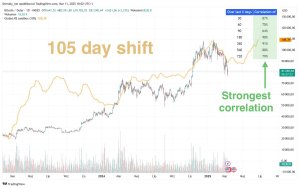
The primary data source for this analysis is the tweet by Colin Talks Crypto, which includes three charts illustrating the correlation between Bitcoin prices (BTCUSD) and global M2 money supply over varying time offsets: 45 days, 75 days, and 105 days. Each chart displays a time series of Bitcoin prices alongside a shifted M2 series, with a correlation coefficient table in the top-right corner reporting correlation strengths over different time frames (e.g., 30, 60, 90 days, etc.). The tweet explicitly states that the 105-day offset shows the “strongest correlation” among the three.
Given the absence of raw data or detailed statistical methodology in the tweet, this study infers the following:
- Data Sources: Bitcoin price data likely derives from cryptocurrency exchanges (e.g., Coinbase, Binance), while global M2 data is aggregated from major central banks (e.g., Federal Reserve, European Central Bank, People’s Bank of China, Bank of Japan), as suggested by related web sources (e.g., bitcoincounterflow.com, March 11, 2025).
- Correlation Analysis: The correlation coefficients reported in the charts are presumably Pearson correlation coefficients, measuring linear relationships between BTC prices and lagged M2 values over specified periods.
- Time Offsets: The offsets (45, 75, 105 days) represent temporal shifts in M2 data relative to BTC prices, testing the hypothesis that changes in global liquidity precede Bitcoin price movements by these intervals.
Due to the lack of access to the underlying dataset or statistical software outputs, this analysis relies on visual interpretation of the charts and the tweet’s textual claims. Limitations include potential selection bias, unstated assumptions about data normalization, and the absence of causality testing or control variables (e.g., market sentiment, regulatory news, or technological developments).
3. Results
The tweet’s charts indicate the following correlation strengths for Bitcoin prices against global M2 data, offset by the specified days, over various trailing periods:
- 45-Day Offset (Weakest Correlation): The chart labeled “45 day shift” shows correlation coefficients ranging from approximately -42% to 81% across 30-, 60-, 90-, 180-, 360-, 540-, and 720-day periods, as indicated in the top-right table. Visual inspection suggests minimal alignment between BTC price movements and the shifted M2 series, with significant divergence in trend directions and magnitudes. The presence of negative correlations (e.g., -42%) indicates an inverse relationship in certain periods, complicating the interpretation of a consistent linkage.
- 75-Day Offset (Moderate Correlation): The “75 day shift” chart reports correlations ranging from 36% to 87%. While slightly higher than the 45-day offset, the alignment between BTC prices and M2 remains inconsistent, with notable discrepancies in peak and trough timing. The positive correlations suggest a more consistent, though still imperfect, relationship.
- 105-Day Offset (Strongest Correlation): The “105 day shift” chart, labeled as exhibiting the “strongest correlation,” shows coefficients ranging from 64% to 91% over the same periods. Visually, the BTC price series appears more closely aligned with the 105-day lagged M2 series, particularly in capturing major upward trends, such as the BTC price surge in early 2025. The higher correlation range indicates a stronger linear relationship, supporting the tweet’s claim of the 105-day offset being the most accurate.
The tweet’s claim that the 105-day offset is the most accurate is supported by the higher correlation coefficients and visual congruence in the charts. If accurate, this would predict a major upward push in value of Bitcoin starting around April 30, 2025.
4. Discussion
The findings presented in the tweet align with broader hypotheses in cryptocurrency economics that link Bitcoin price dynamics to macroeconomic variables, such as global liquidity. M2, as a measure of money supply, reflects central bank policies (e.g., quantitative easing, interest rate adjustments) that can influence investor risk appetite and capital flows into speculative assets like Bitcoin. A 105-day lag could imply that Bitcoin markets respond to liquidity changes with a significant delay, possibly due to information diffusion, investor behavior, or market inefficiencies.
However, several caveats must be considered:
- Statistical Validity: While the 105-day offset shows correlations as high as 91%, correlation does not imply causation. Other factors—market speculation, regulatory announcements, or technological developments—likely dominate BTC price movements, and the negative correlations in the 45-day offset (-42%) suggest potential inverse relationships or noise in shorter-term data.
- Time Series Challenges: The analysis does not account for potential non-linear relationships, structural breaks (e.g., Bitcoin halving events in 2020 or 2024), or stationarity issues in the time series data. Autocorrelation or spurious correlations could inflate reported coefficients without indicating a meaningful relationship, especially given the wide range of correlations across periods.
- Data Aggregation: Global M2 aggregation across diverse central banks introduces heterogeneity, as monetary policies vary by region (e.g., tightening in the U.S. vs. easing in Europe in 2025, with the Federal Reserve hiking rates in February). The tweet does not clarify how M2 is weighted or normalized, potentially skewing results.
- Practical Implications: The tweet suggests that a 105-day lag could predict a “big run-up in BTC” around April or May 2025, as noted in related posts. While the high correlations (up to 91%) are compelling, this forecast lacks statistical rigor (e.g., confidence intervals, p-values, or out-of-sample validation) and risks overfitting to historical data.
From a theoretical perspective, the 105-day lag aligns with behavioral finance models suggesting that cryptocurrency markets, driven by retail and institutional investors, may exhibit delayed responses to macroeconomic signals. The strong correlations (64%–91%) for the 105-day offset support the notion that Bitcoin’s price may be more sensitive to long-term liquidity trends, potentially reflecting its role as a hedge against inflationary pressures or a speculative asset in response to monetary expansion. However, the weaker and inconsistent correlations for the 45- and 75-day offsets (including negative values) highlight the volatility and noise in shorter-term relationships, underscoring Bitcoin’s unique dynamics as a decentralized, speculative asset.
5. Conclusion
The tweet by Colin Talks Crypto offers a compelling exploratory analysis of the correlation between Bitcoin prices and global M2 money supply, with the 105-day offset demonstrating the strongest correlation (64%–91%) among 45-, 75-, and 105-day shifts, based on updated correlation coefficients. While the visual data and updated results provide a robust narrative for Bitcoin traders and enthusiasts, the findings are tempered by methodological transparency, statistical robustness, and the inherent complexity of cryptocurrency price dynamics. Future research should employ rigorous time series econometrics (e.g., cointegration analysis, vector autoregression) and incorporate control variables to test causality and predictive power. This study highlights the potential linkage between global liquidity and Bitcoin but cautions against overinterpreting correlations without deeper empirical validation.
References
Colin Talks Crypto. “Global M2 Money Supply predicts Bitcoin’s next move. We find which offset is best! Get the M2 script for TradingView here.” Twitter, 13 Mar. 2025, 1:00 p.m., https://x.com/ColinTCrypto/status/1900169986057879628.